우리는 작성한 API 에 병목 현상과 얼마 만큼의 트래픽을 수용할 수 있는지에 대한 여부를 확인하고자 스트레스 테스트를 작성한다. 통상 자바환경에 익숙하다면 스트레스 테스트를 생각하면 ngrinder (또는 grinder) 를 먼저 생각하게 되는데, 본인은 Node 환경에서 아주 가볍게 스트레스 테스트를 구성하고 싶었고 그 요구 사항에 맞는 툴을 리서치하다 third party 로 제공하는 Artillery 를 알게되었다. 본 문서에서는 Artillery 을 통해 스트레스 테스트를 진행하며 느낀 점과 그 방법에 대해 얘기해보고자한다.
문서 작성 시점 기준으로 Artillery 의 Github 스타는 3.6k 정도 되고, 아직 개선할 사항들이 많아 보이긴 하지만 사용에 있어 크게 불편한점은 찾지 못했다. 무료 버전과 유료 버전으로 나뉘는데 무료 버전을 사용해도 대세에는 크게 지장 없다. 그래도 회사에서 운영하는 프로젝트이다보니 업데이트는 꾸준히 존재한다. 아래는 본인이 정리한 Artillery 의 특징이다.
- HTTP, Websocket 프로토콜을 지원한다
- Javascript 를 통해 필요에 따른 로직을 구성할 수 있다.
- 2번에 해당 하는 내용에 대해 아래와 같은 Trigging point 를 제공한다.
- beforeScenario: called before a virtual user executes a scenario
- afterScenario: called after a virtual user executes a scenario
- beforeRequest: called before a request is sent; request parameters (URL, cookies, headers, body etc) can be customized here
- afterResponse: called after a response has been received; the response can be inspected and custom variables can be set here
- function: which can be inserted as a step at any point in a scenario
- 외부 모니터링 시스템 Publish 가능하여 실시간으로 매트릭스 구성가능하다. (Datadog, StatsD, InfluxDB)
- 시나리오 케이스를 추가할 수 있다.
- 풍부한 CLI 커맨드를 제공한다.
- 리포트 페이지를 제공한다.
2번에 해당하는 내용 때문에 Node 환경에서는 Artillery 를 사용하는게 이점이 더 크다.
설치
공식 문서에서는 -g 옵션을 통해 전역적으로 설치하기를 안내하지만, 개인적으로 전역 설치를 좋아하지 않는 본인이라 npm run artillery -D 해당 명령어를 통해 프로젝트 내 dev dependency 로 설치했다. (꼭 dev dependency 로 설치해주세요, 프로덕션 레벨에서 쓰이지 않습니다.)
Youngjunui-iMac:artillery-test youngjun$ npm i artillery -D
npm WARN deprecated [email protected]: request has been deprecated, see https://github.com/request/request/issues/3142

> [email protected] postinstall /Users/youngjun/artillery-test/node_modules/ajv
> opencollective-postinstall || true

Thank you for using ajv!
If you rely on this package, please consider supporting our open collective:
> https://opencollective.com/ajv/donate


> [email protected] postinstall /Users/youngjun/artillery-test/node_modules/jsonpath
> node lib/aesprim.js > generated/aesprim-browser.js

npm WARN saveError ENOENT: no such file or directory, open '/Users/youngjun/artillery-test/package.json'
npm notice created a lockfile as package-lock.json. You should commit this file.
npm WARN enoent ENOENT: no such file or directory, open '/Users/youngjun/artillery-test/package.json'
npm WARN artillery-test No description
npm WARN artillery-test No repository field.
npm WARN artillery-test No README data
npm WARN artillery-test No license field.

+ [email protected]
added 268 packages from 267 contributors and audited 433 packages in 12.806s

15 packages are looking for funding
  run `npm fund` for details

found 0 vulnerabilities
설치를 끝내고, CLI 를 통해 사용 설명을 실행해보니 아래와 같이 제공하는 여러 커맨드들이 나왔다.
- run [options]
- quick [options]
Run a quick test without writing a test script - report [options]
Create a report from a JSON file created by "artillery run" - convert
Convert JSON to YAML and vice versa - dino [options] Show dinosaur of the day
이 커맨드를 보는 여러분도 dino 라는 커맨드에 눈길이 가실 것 같다. 프로젝트 개발자 이스터에그 정도로 보이고, 실행해보니 공룡이 나왔다. (힁..)
Youngjunui-iMac:artillery-test youngjun$ ./node_modules/.bin/artillery dino
 ------------
< Artillery! >
 ------------
          \
           \
                         .@
                        @.+
                       @,
                      @'
                     @'
                    @;
                  `@;
                 @+;
              .@#;'
         #@###@;'.
       :#@@@@@;.
      @@@+;'@@:
    `@@@';;;@@
   @;:@@;;;;+#
`@;`  ,@@,, @@`
      @`@   @`+
      @ ,   @ @
      @ @   @ @
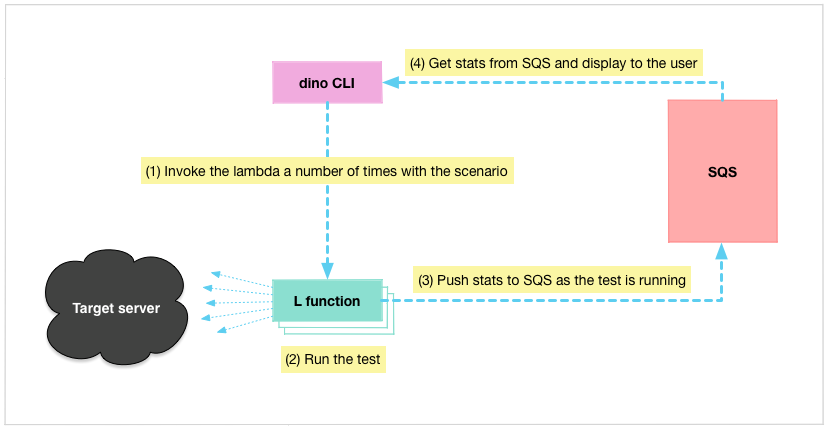
궁금한건 못 참아서, 본 프로젝트랑 공룡이랑 뭔 상관이 있는지 좀 찾아보니 artillery-dino 라는 프로젝트가 존재하고 artillery 를 베이스로 하며 사용하면 AWS Lambda에서 스트레스 테스트를 실행할 수 있다고 한다. (다만, 업데이트가 무려 4년전의 실험체라는 것..)
간단한 테스트하기
위 나열한 명령어 중 “quick” 의 경우 ab 처럼 특정 URL 에 대해 간단한 스트레스 테스트를 진행하고자 할때 용이하다.
테스트에 앞 서, 아래와 같이 데이트 정보가 담긴 파일을 생성 후 해당 데이트 정보를 응답하는 간단한 코드를 작성했다.
import * as http from 'http';
import * as fs from 'fs';

http.createServer((req, res) => {
  const dt = new Date();
  fs.writeFileSync(dt.toString(), dt);

  res.writeHead(200, {'Content-Type': 'text/plain'});
  res.write(dt.toString());
  res.end();
}).listen(8080);
./node_modules/artillery/bin/artillery quick –duration 60 –rate 10 -n 20 http://localhost:8080
옵션 중, duration 은 테스트 진행 시간을 가르키고 rate 는 초당 요청을 의미하며 n 은 동시 접속 수를 의미한다.
즉 60초 동안 초당 10초, 동시 접속은 20으로 하여 테스트를 진행한다는 것이다. 아래 로그를 확인 하면 총 600개의 시나리오를 보내고 총 요청수가 12,000 인 것을 확인할 수 있다. 좀 더 상세한 옵션에 대한 내용을 보고 싶다면 -h 를 통해 확인 할 수 있다.
Started phase 0, duration: 60s @ 20:29:56(+0900) 2020-04-25
Report @ 20:30:06(+0900) 2020-04-25
Elapsed time: 10 seconds
  Scenarios launched:  99
  Scenarios completed: 99
  Requests completed:  1980
  Mean response/sec: 200.81
  Response time (msec):
    min: 0.4
    max: 11.3
    median: 0.6
    p95: 1.6
    p99: 2.4
  Codes:
    200: 1980

--- 중략 ---

Report @ 20:30:56(+0900) 2020-04-25
Elapsed time: 1 minute, 0 seconds
  Scenarios launched:  100
  Scenarios completed: 100
  Requests completed:  2000
  Mean response/sec: 200.2
  Response time (msec):
    min: 0.3
    max: 9.3
    median: 0.4
    p95: 1.3
    p99: 1.7
  Codes:
    200: 2000

Report @ 20:30:56(+0900) 2020-04-25
Elapsed time: 1 minute, 0 seconds
  Scenarios launched:  1
  Scenarios completed: 1
  Requests completed:  20
  Mean response/sec: 39.22
  Response time (msec):
    min: 0.4
    max: 12.9
    median: 0.4
    p95: 8.8
    p99: 12.9
  Codes:
    200: 20

All virtual users finished
Summary report @ 20:30:56(+0900) 2020-04-25
  Scenarios launched:  600
  Scenarios completed: 600
  Requests completed:  12000
  Mean response/sec: 198.68
  Response time (msec):
    min: 0.3
    max: 12.9
    median: 0.5
    p95: 1.4
    p99: 1.8
  Scenario counts:
    0: 600 (100%)
  Codes:
    200: 12000
테스트 결과들은 중간 중간 rate 간격으로 보여주고 테스트를 마치면 상세 전체 정보를 출력한다. p95와 p99는 퍼센타일(Percentile)값으로 Request latency 만 볼 때 95 % 에 있는 요청이 8.8ms 초가 걸렸고, 99%에 해당하는 요청은 12.9ms 가 걸려 느린 요청에 분포를 볼 수 있다. 마지막으로 응답 받은 HTTP 상태코드를 볼 수 있는데, 다행히도 12000 건 모두 성공 요청으로 처리되었다. 만약 500대 에러가 발생한다면 메모리 릭이나 로직 상 문제가 있음을 가르키기에 사전에 디버깅이 가능하다.
시나리오 작성하여 테스트하기
실제 성능 테스트를 하기 위해선 좀 더 사용자 시나리오에 가까운 테스트가 필요하다. 이 때 위에서 언급한 시나리오 그 역할을 수행해준다.
수월한 테스트 진행을 위해 일전 테스트 코드에서 좀 더 내용을 붙여 생성된 파일을 삭제하는 로직에 대해 추가했다. 코드는 아래와 같다.
import * as http from 'http';
import * as fs from 'fs';

http.createServer((req, res) => {
  try {
      res.writeHead(200, {'Content-Type': 'application/json'});

      if (req.method?.toLowerCase() === 'get') {
          const dt = new Date();
          fs.writeFileSync(dt.getTime().toString(), dt);
          res.write(JSON.stringify({
              hashKey: dt.getTime().toString()
          }));
      }
      if (req.method?.toLowerCase() === 'delete') {
          const dtPath = req.url?.split('/').filter(path => !!path)[0];
          fs.unlinkSync(dtPath as string);
          res.write(JSON.stringify({}));
      }

      res.end();
  } catch (error) {
      res.writeHead(400, {'Content-Type': 'text/plain'});;
      res.write(error.toString());
      res.end();
  }
}).listen(8080);
이 코드를 수행하기 위해 Artillery 설정 파일에 시나리오를 작성해보자. 여기서 꽤나 유용한 프로퍼티가 capture 이다. capture 를 통해 응답 값에 대해 변수화 할 수 있다. 본 예제에서는 다루기 어려운 프로퍼티가 processor 인데, js로 context 를 핸들링할 수 있다. 이를 테면, Authentication 로직이 있다고 하자, processor 에 내용을 정의하고 beforeScenario 와 같은 트리깅 포인트에서 AccessToken 을 변수화 할 수 있다. 우선 아래 예제를 아래 명령어를 통해 수행해보자.
// artillery-config.yml
// target 은 테스할 대상의 주소이며 phases 는 테스트 요청 시간과 비율을 정한다.
config:
  target: http://localhost:8080
  tls:
  rejectUnauthorized: false
  phases:
    - duration: 10
      arrivalRate: 100
scenarios:
  - name: '파일을 생서 후, 삭제한다.'
    flow:
      - get:
          url: "/"
          capture:
            json: "$.hashKey"
            as: "hashKey"

      - delete:
          url: "/"
결과 확인하기
수행한 결과는 아래와 같다.
➜  test-server ./node_modules/artillery/bin/artillery run artillery-config.yml

Started phase 0, duration: 10s @ 22:01:23(+0900) 2020-04-25
Report @ 22:01:33(+0900) 2020-04-25
Elapsed time: 10 seconds
  Scenarios launched:  999
  Scenarios completed: 998
  Requests completed:  1997
  Mean response/sec: 200.8
  Response time (msec):
    min: 0.4
    max: 19.5
    median: 1.1
    p95: 2
    p99: 4.4
  Codes:
    200: 1997

Report @ 22:01:34(+0900) 2020-04-25
Elapsed time: 10 seconds
  Scenarios launched:  1
  Scenarios completed: 2
  Requests completed:  3
  Mean response/sec: 4
  Response time (msec):
    min: 0.5
    max: 31.3
    median: 2.2
    p95: 31.3
    p99: 31.3
  Codes:
    200: 3

All virtual users finished
Summary report @ 22:01:34(+0900) 2020-04-25
  Scenarios launched:  1000
  Scenarios completed: 1000
  Requests completed:  2000
  Mean response/sec: 190.84
  Response time (msec):
    min: 0.4
    max: 31.3
    median: 1.1
    p95: 2
    p99: 4.4
  Scenario counts:
    파일을 생서 후, 삭제한다.: 1000 (100%)
  Codes:
    200: 2000
60초 동안 매초 100개의 요청을 보냈다. 위와 같이 아주 깔끔하게 성공한 것을 확인할 수 있다.
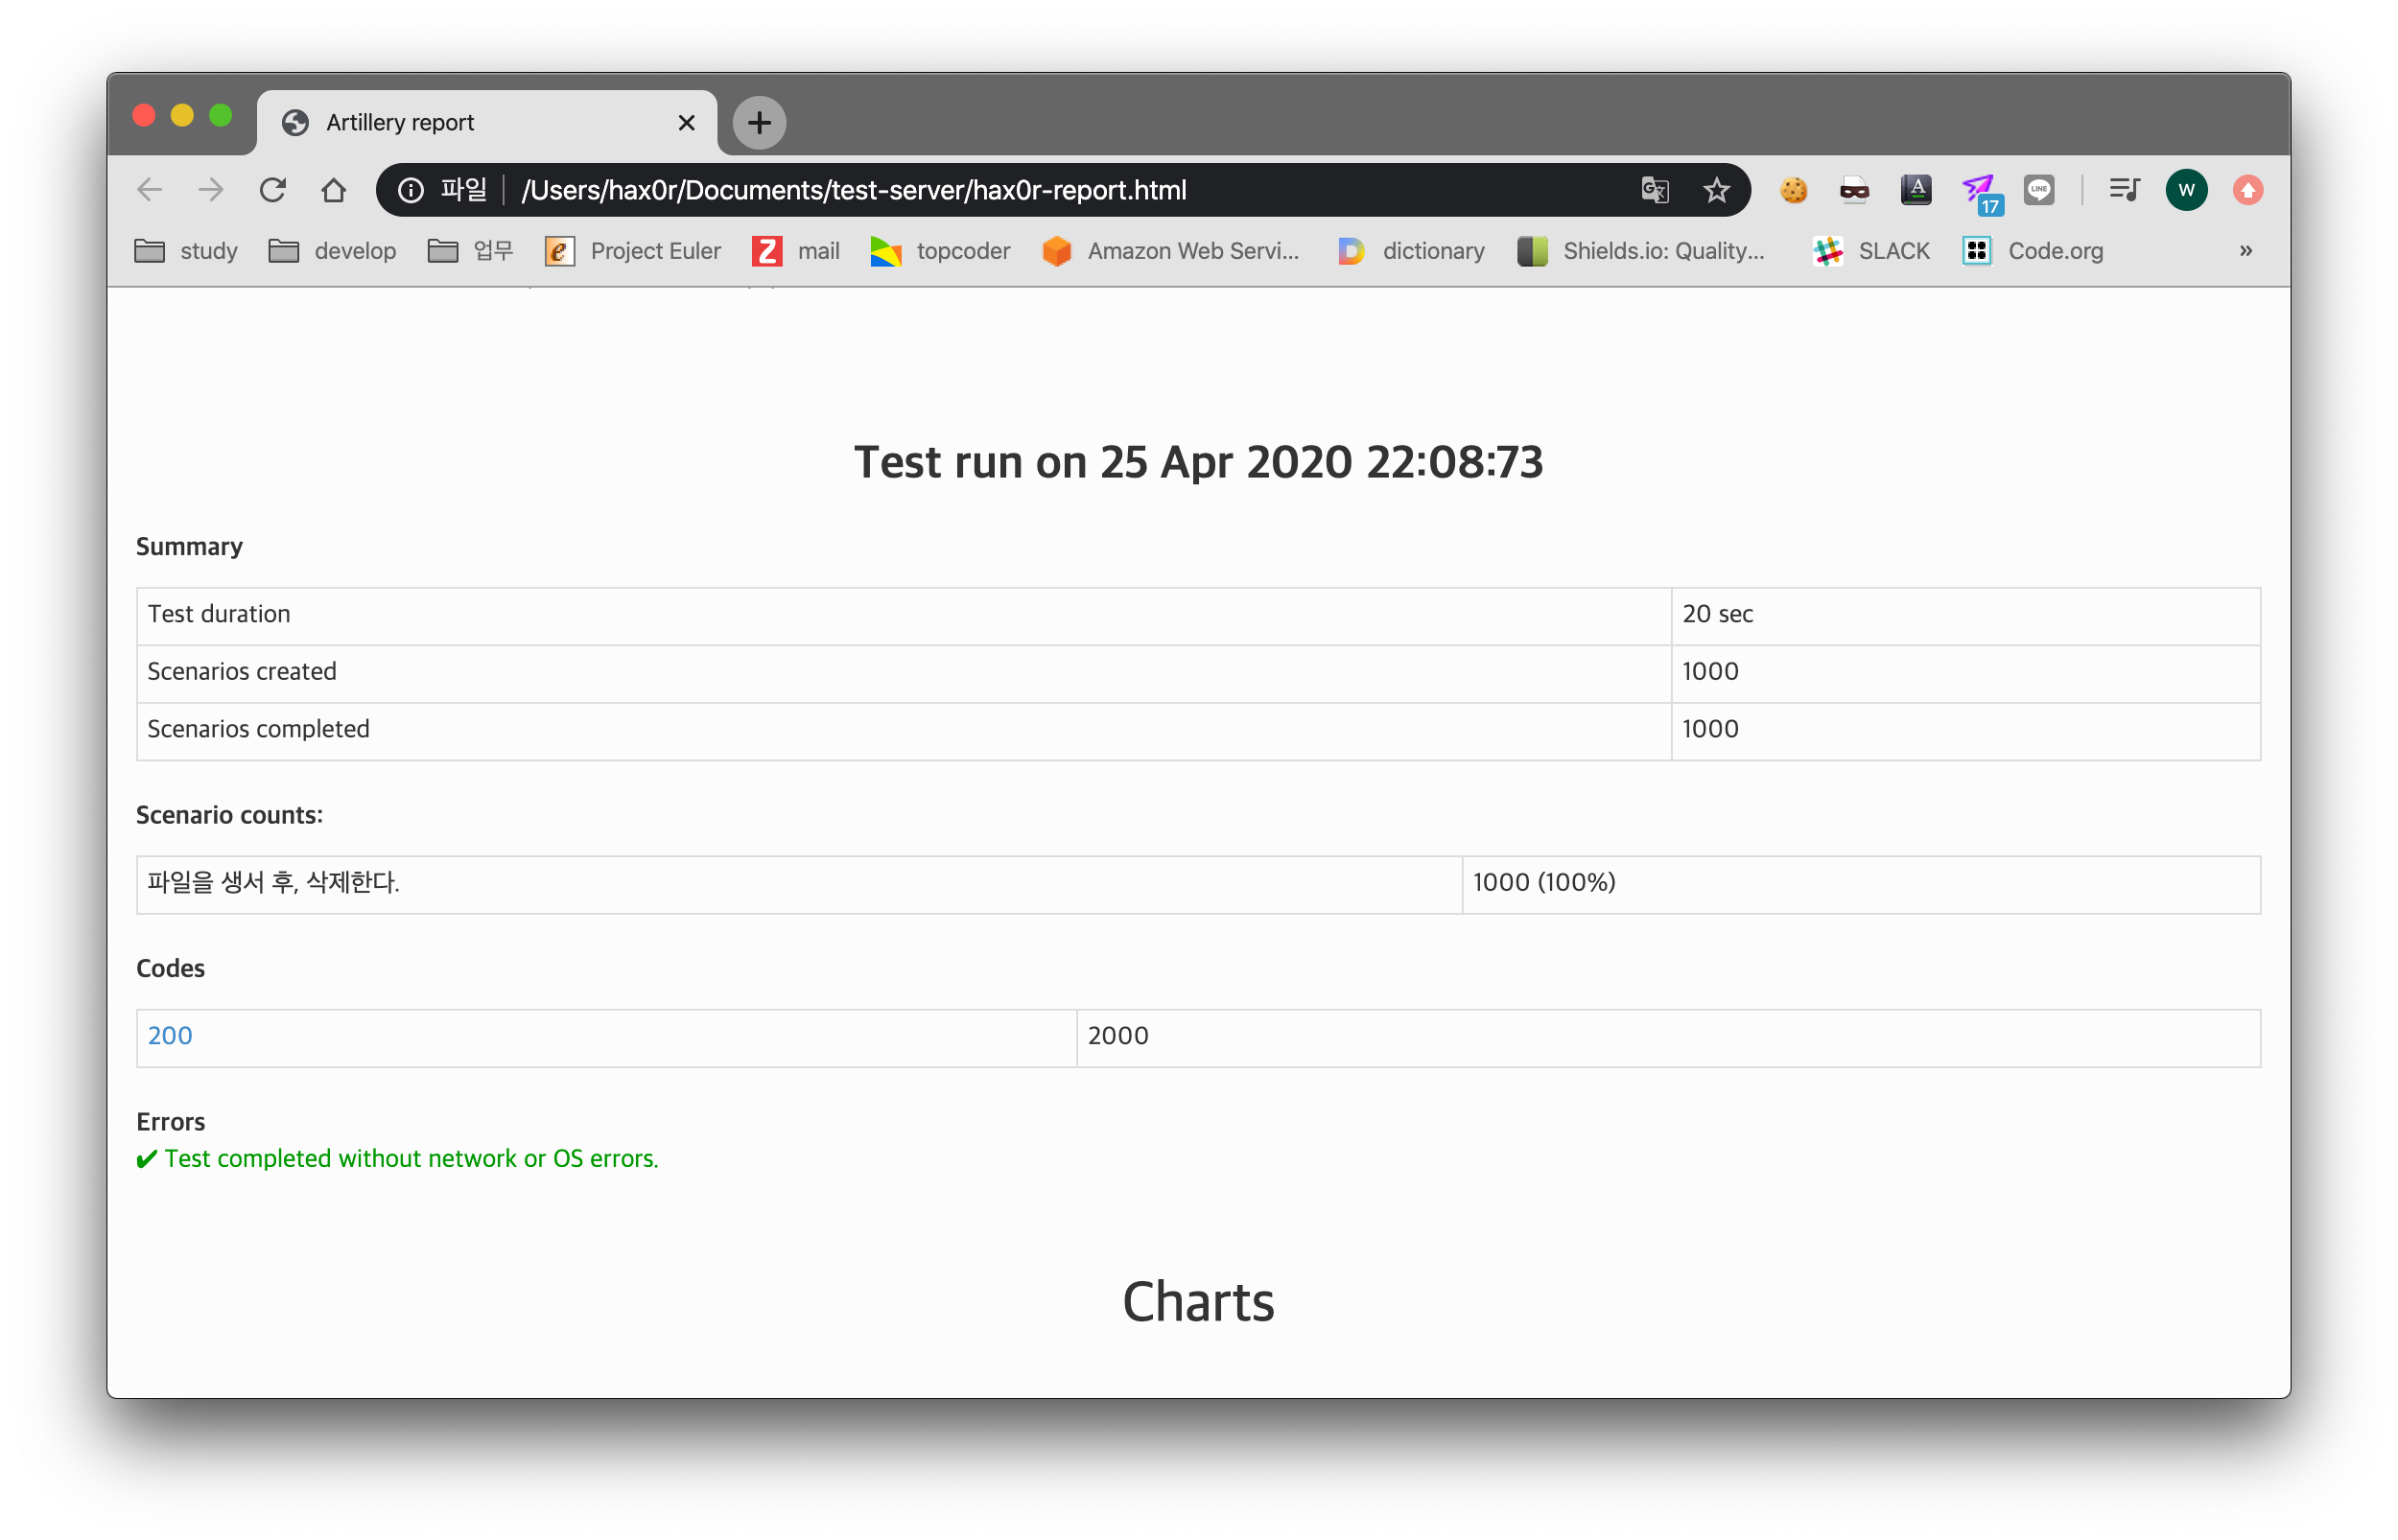
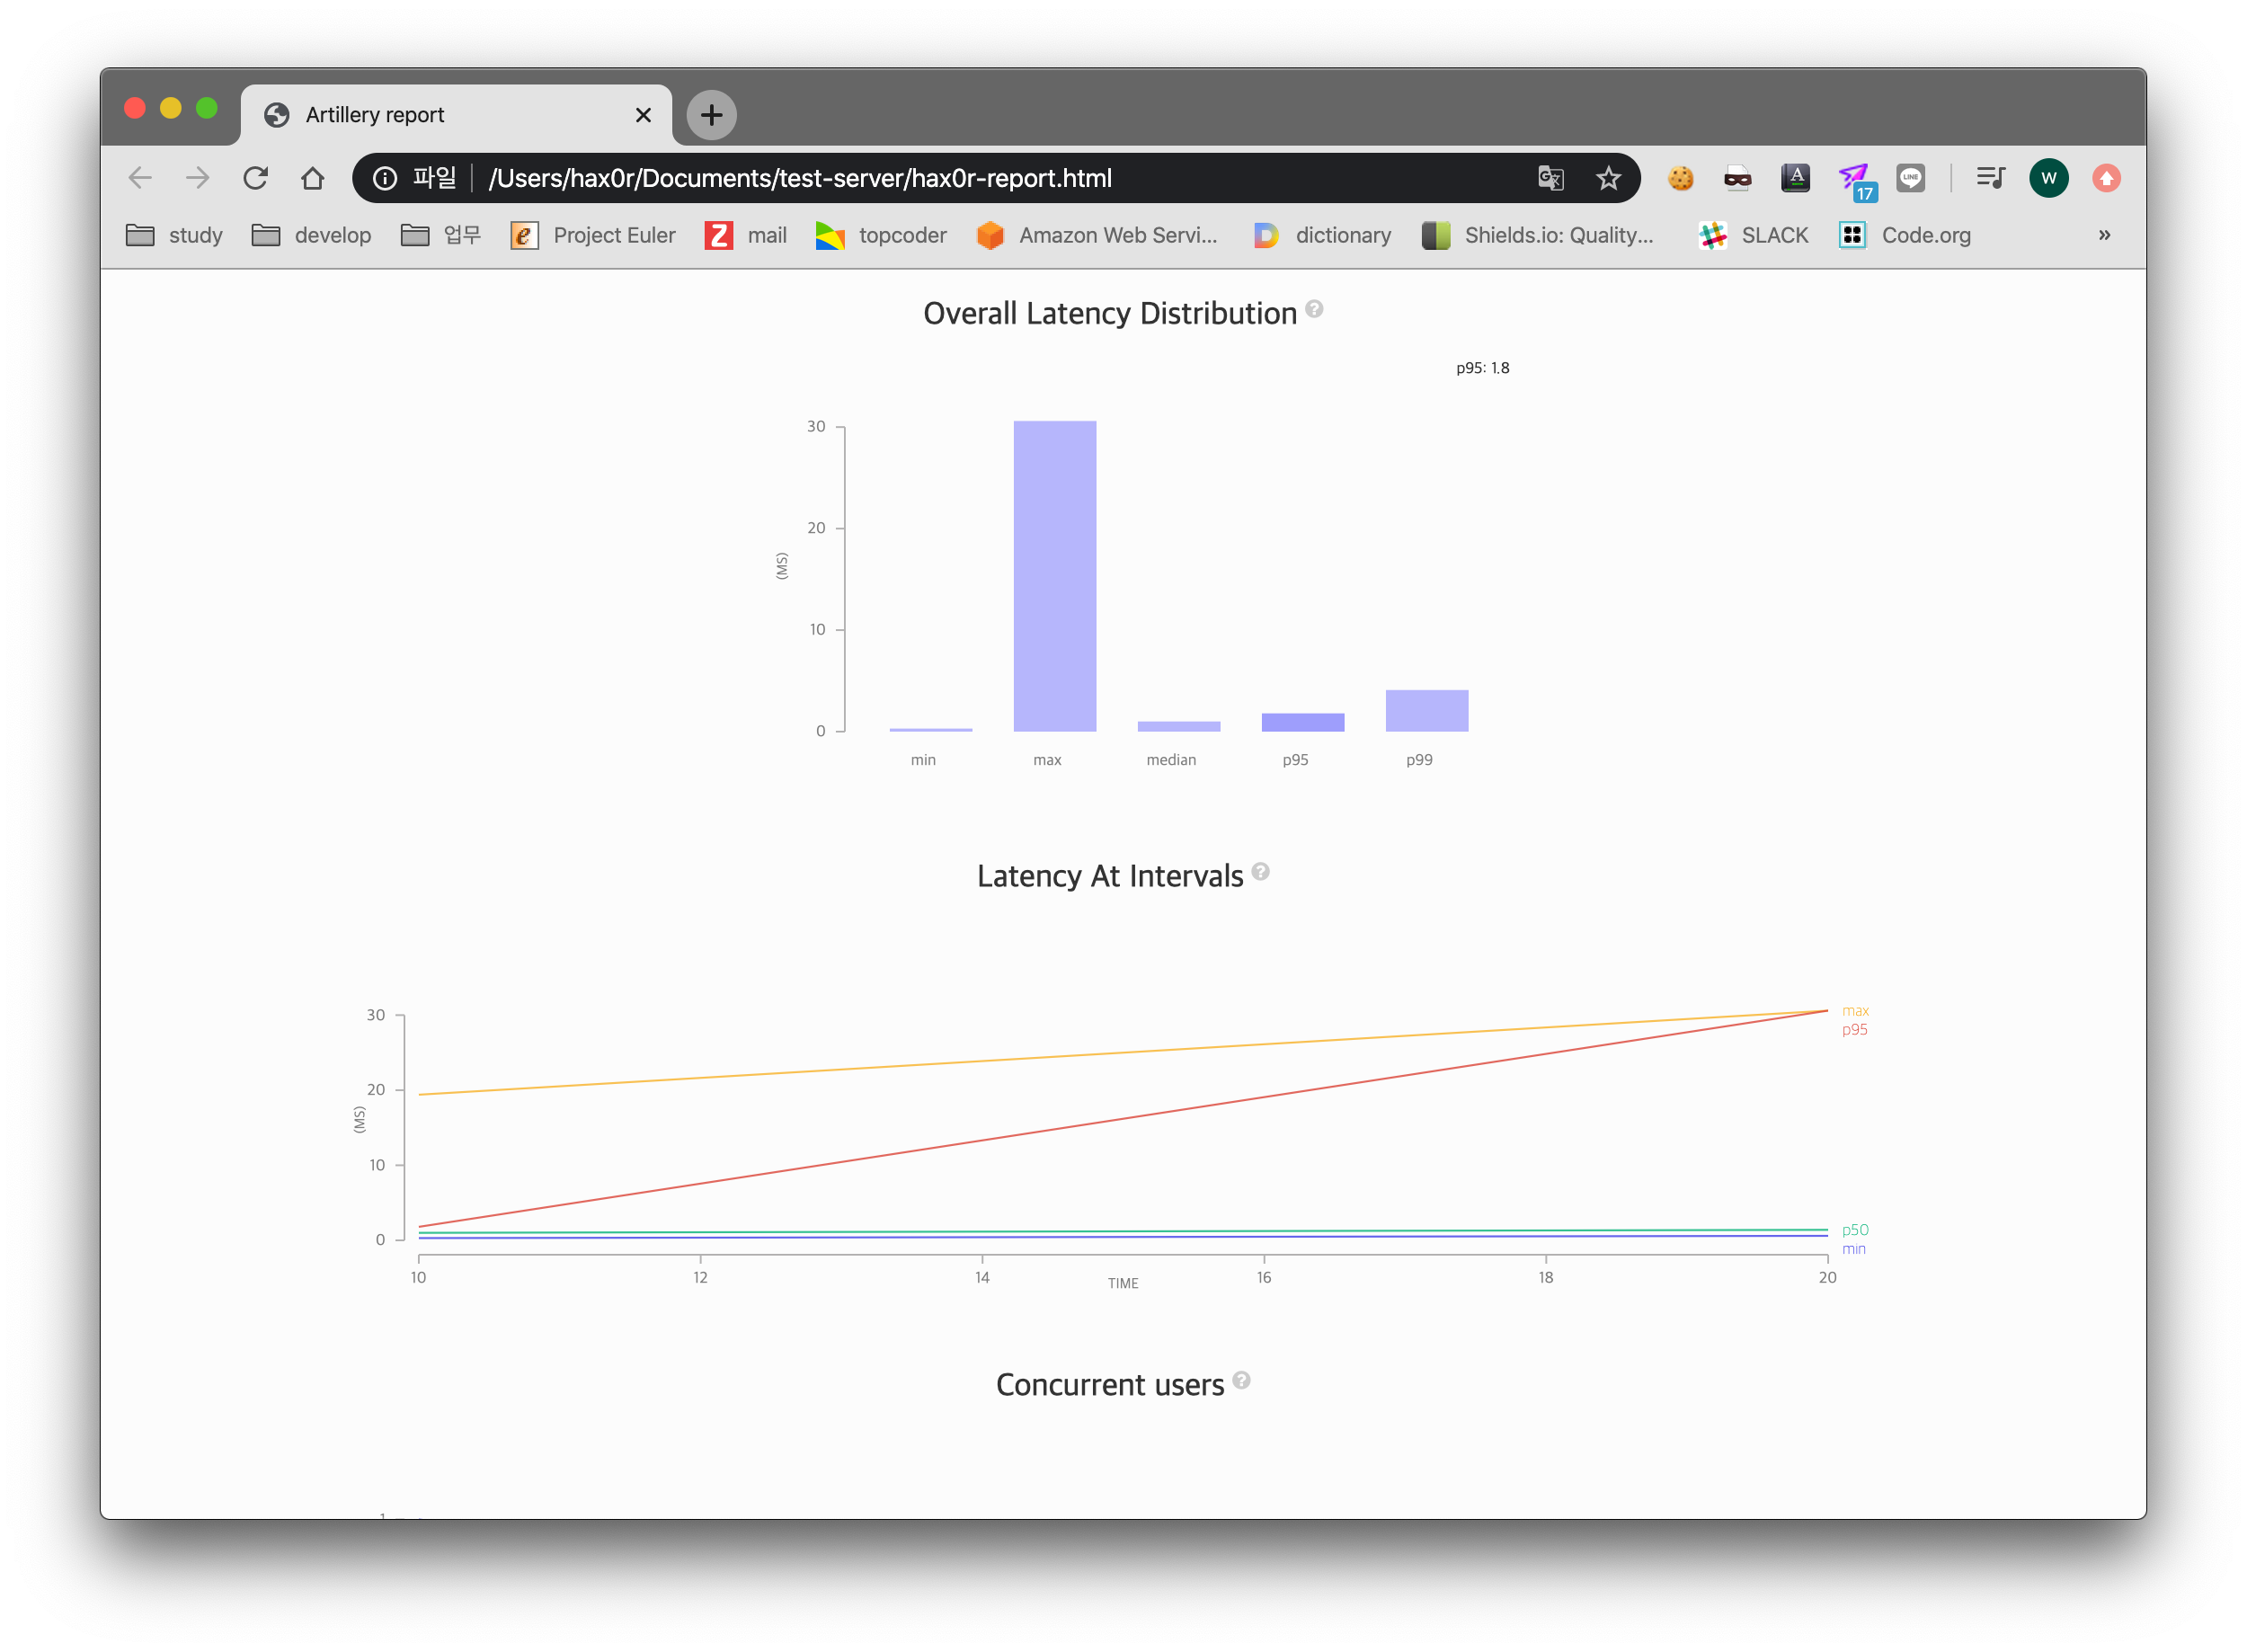
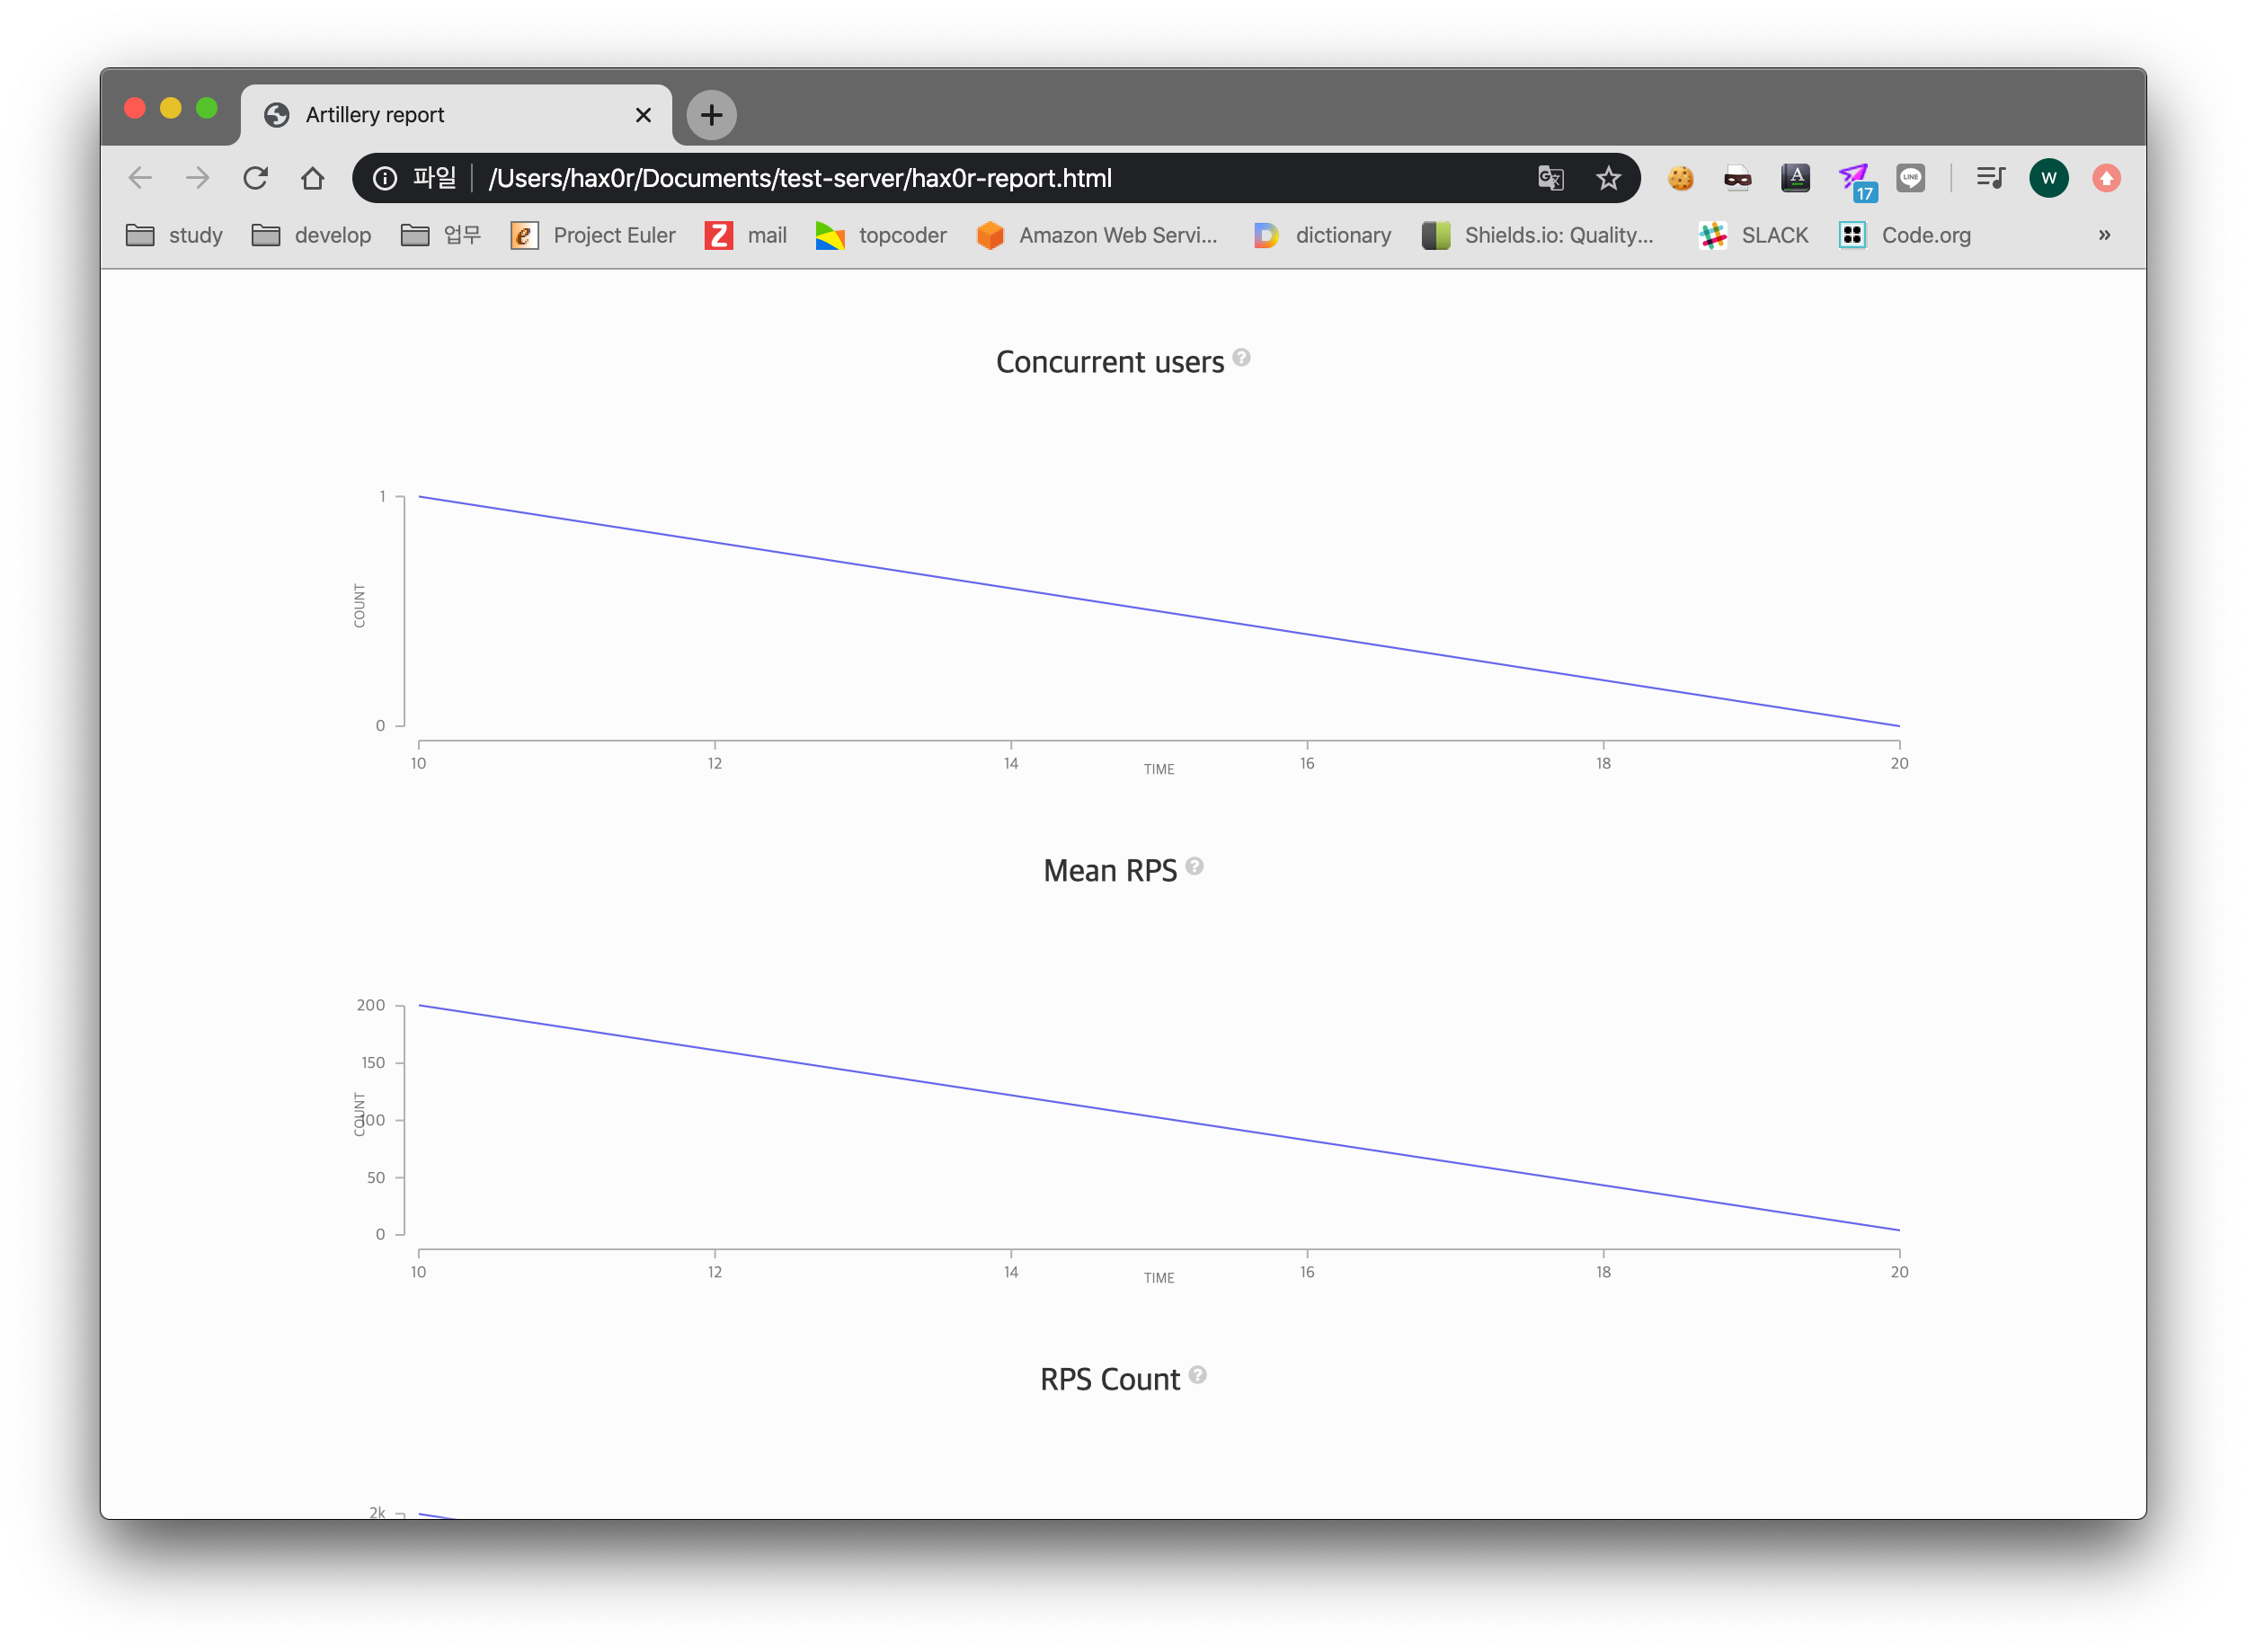
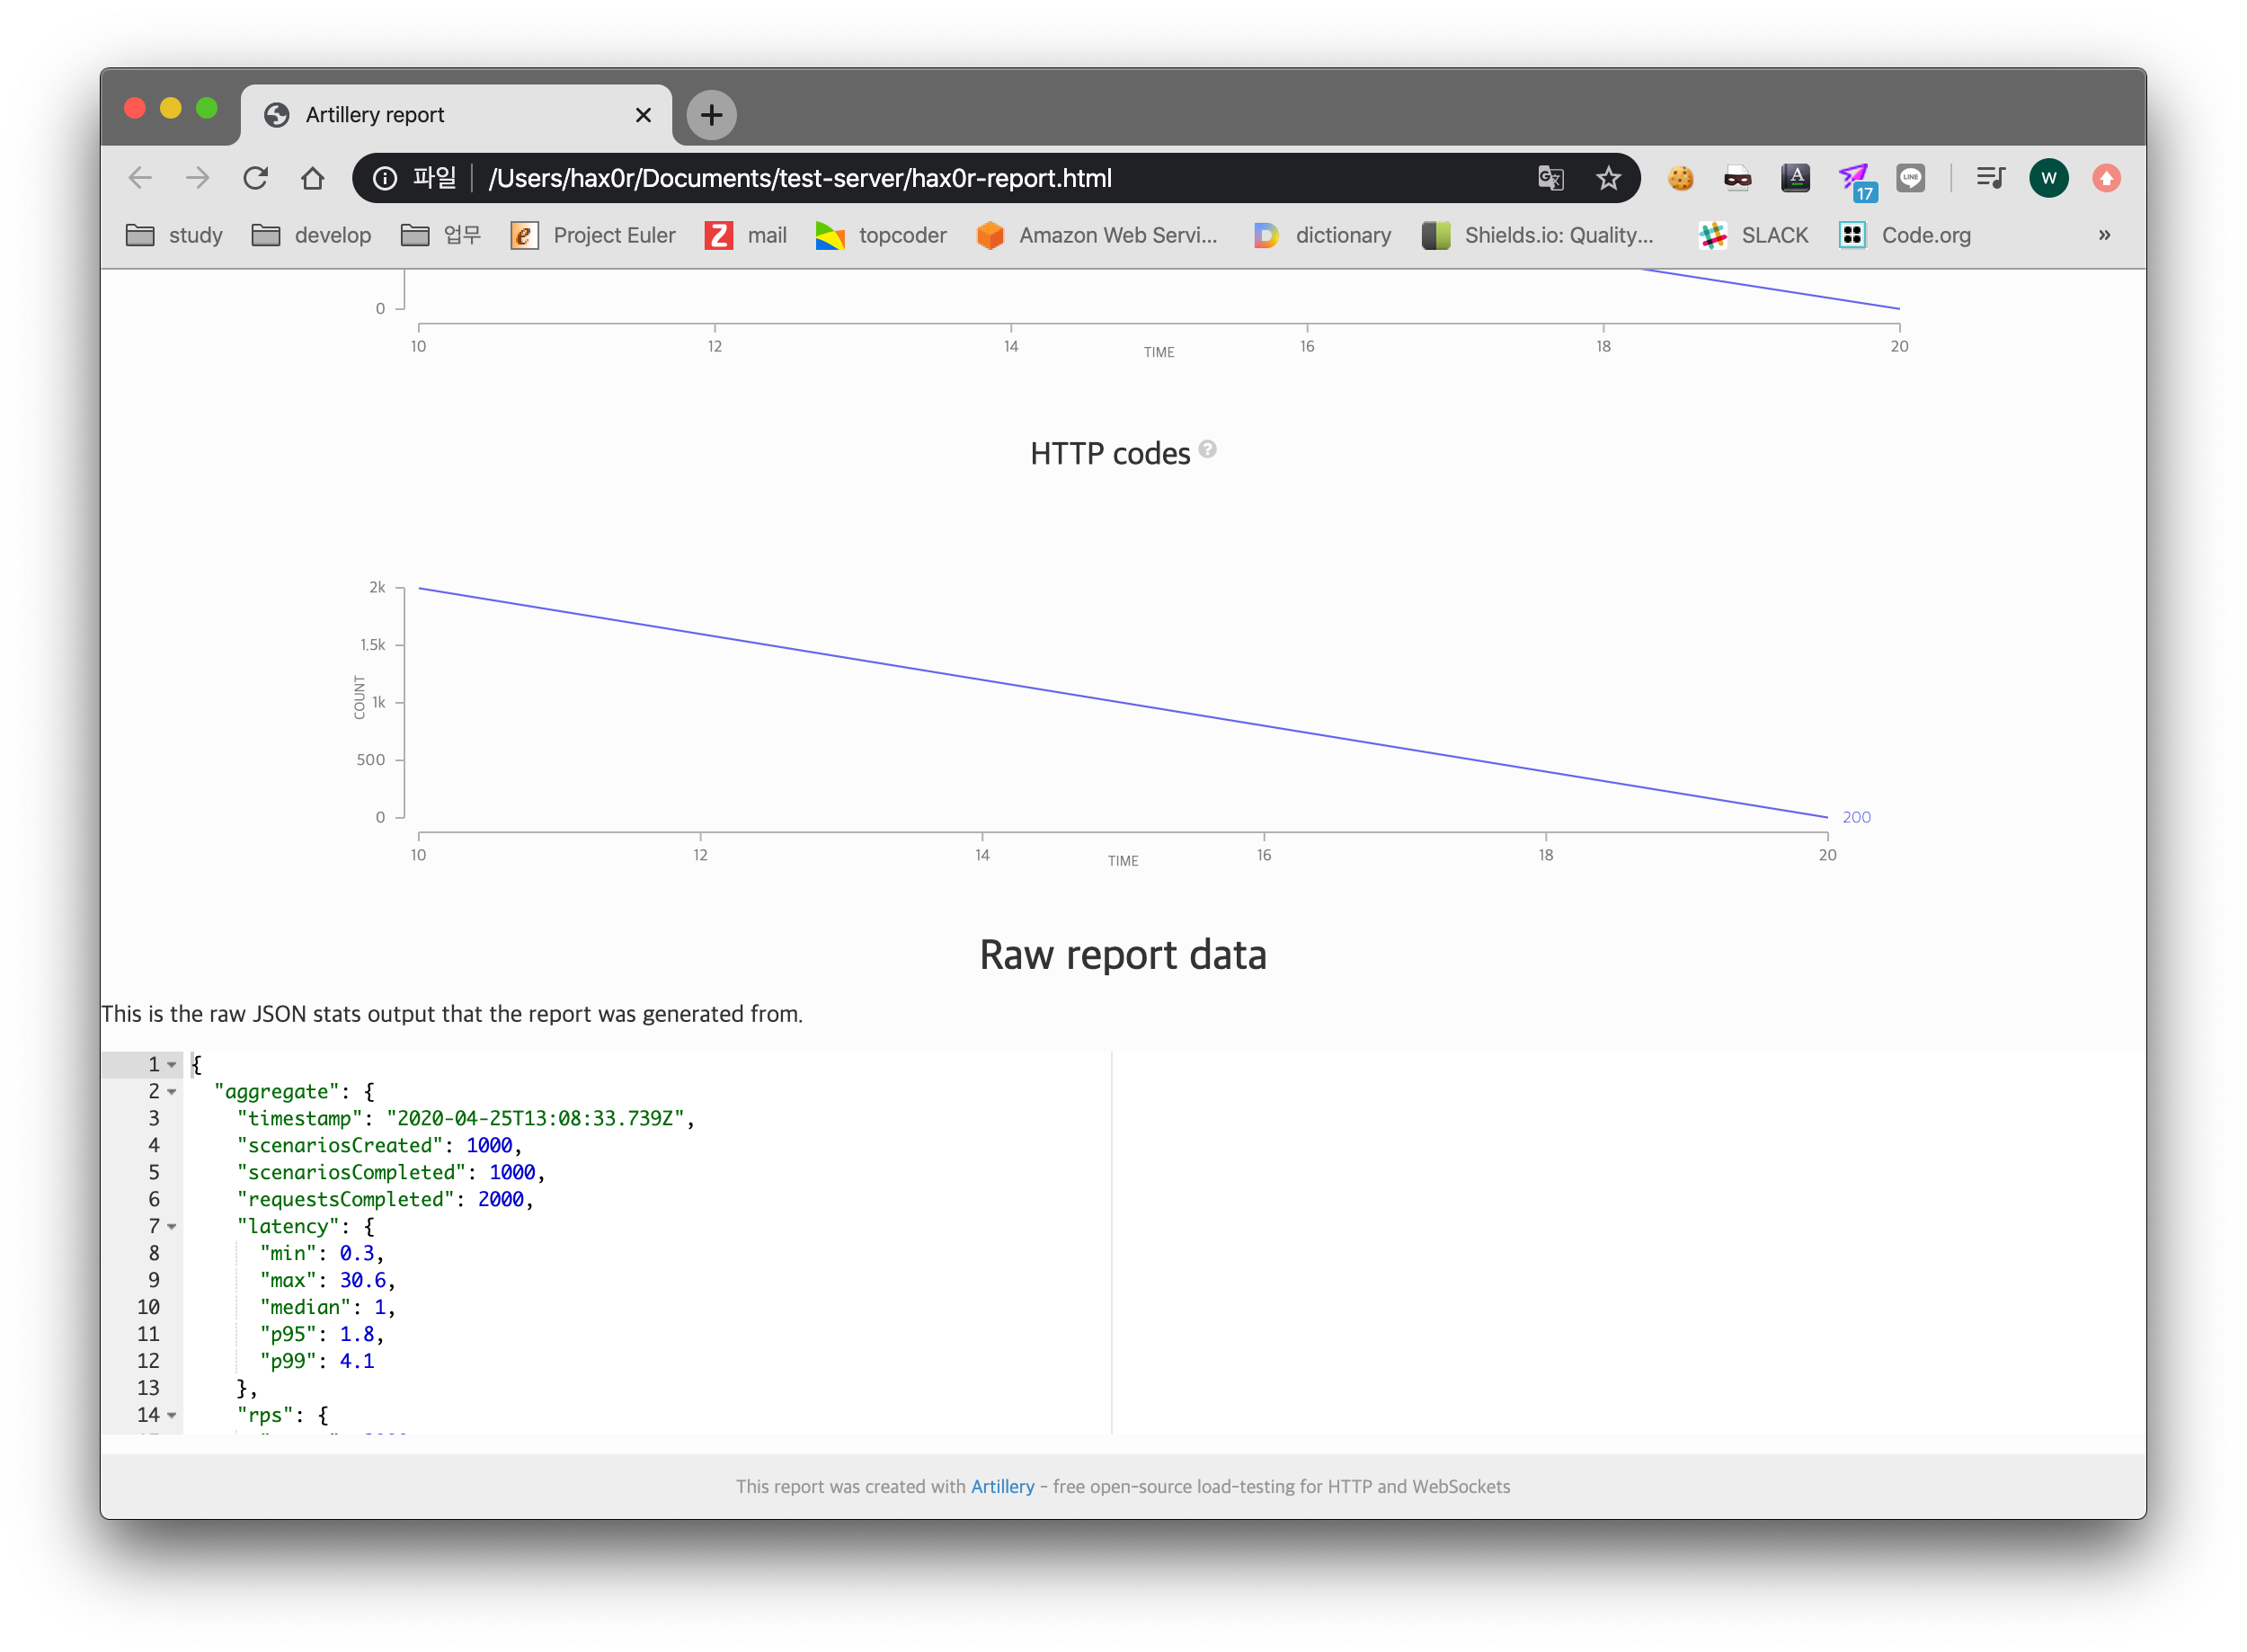
좀 더 상세하게 visualizing 된 내용을 확인하고 싶다면 report 를 사용해보자. 아래 커맨드를 통해 report 파일을 생성할 수 있다.
./node_modules/artillery/bin/artillery run -o hax0r-report artillery-config.yml
이후 루트 디렉토리에 hax0r-report 가 생성되는데, 해당 파일을 기준으로 visualizing 된 화면을 확인할 수 있다. 아래 명령어를 아래 화면들이 뜰 것 이다.
./node_modules/artillery/bin/artillery report hax0r-report
Report generated: hax0r-report.html
마치며
통상 AWS 리소스를 사용한다면 ALB 가 부하에 대한 어느 정도에 안정 장치 역할로서 서포트 해 줄 수 있다. 요청된 리소스를 pod 상태를 확인하며 재분배하기 때문이다. 하지만 이는 어디 까지나 pod 에 대한 보장이지 코드 레벨에 대한 보장은 아니다. 어딘가 메모리 누수가 발생한다거나 third-party 에 대한 pool 이슈로 요청을 수행 못할 케이스도 존재한다.
조금 팁을 드리자면 병목 현상에 대한 프로파일링 툴로써 node-clinic 을 추천한다. 아래와 같은 명령어들이 존재하며, 아래 화면의 경우 bubbleprof 로 진행했다.
- clinic doctor –help
- clinic bubbleprof –help
- clinic flame –help
- clinic upload –help
- clinic ask –help
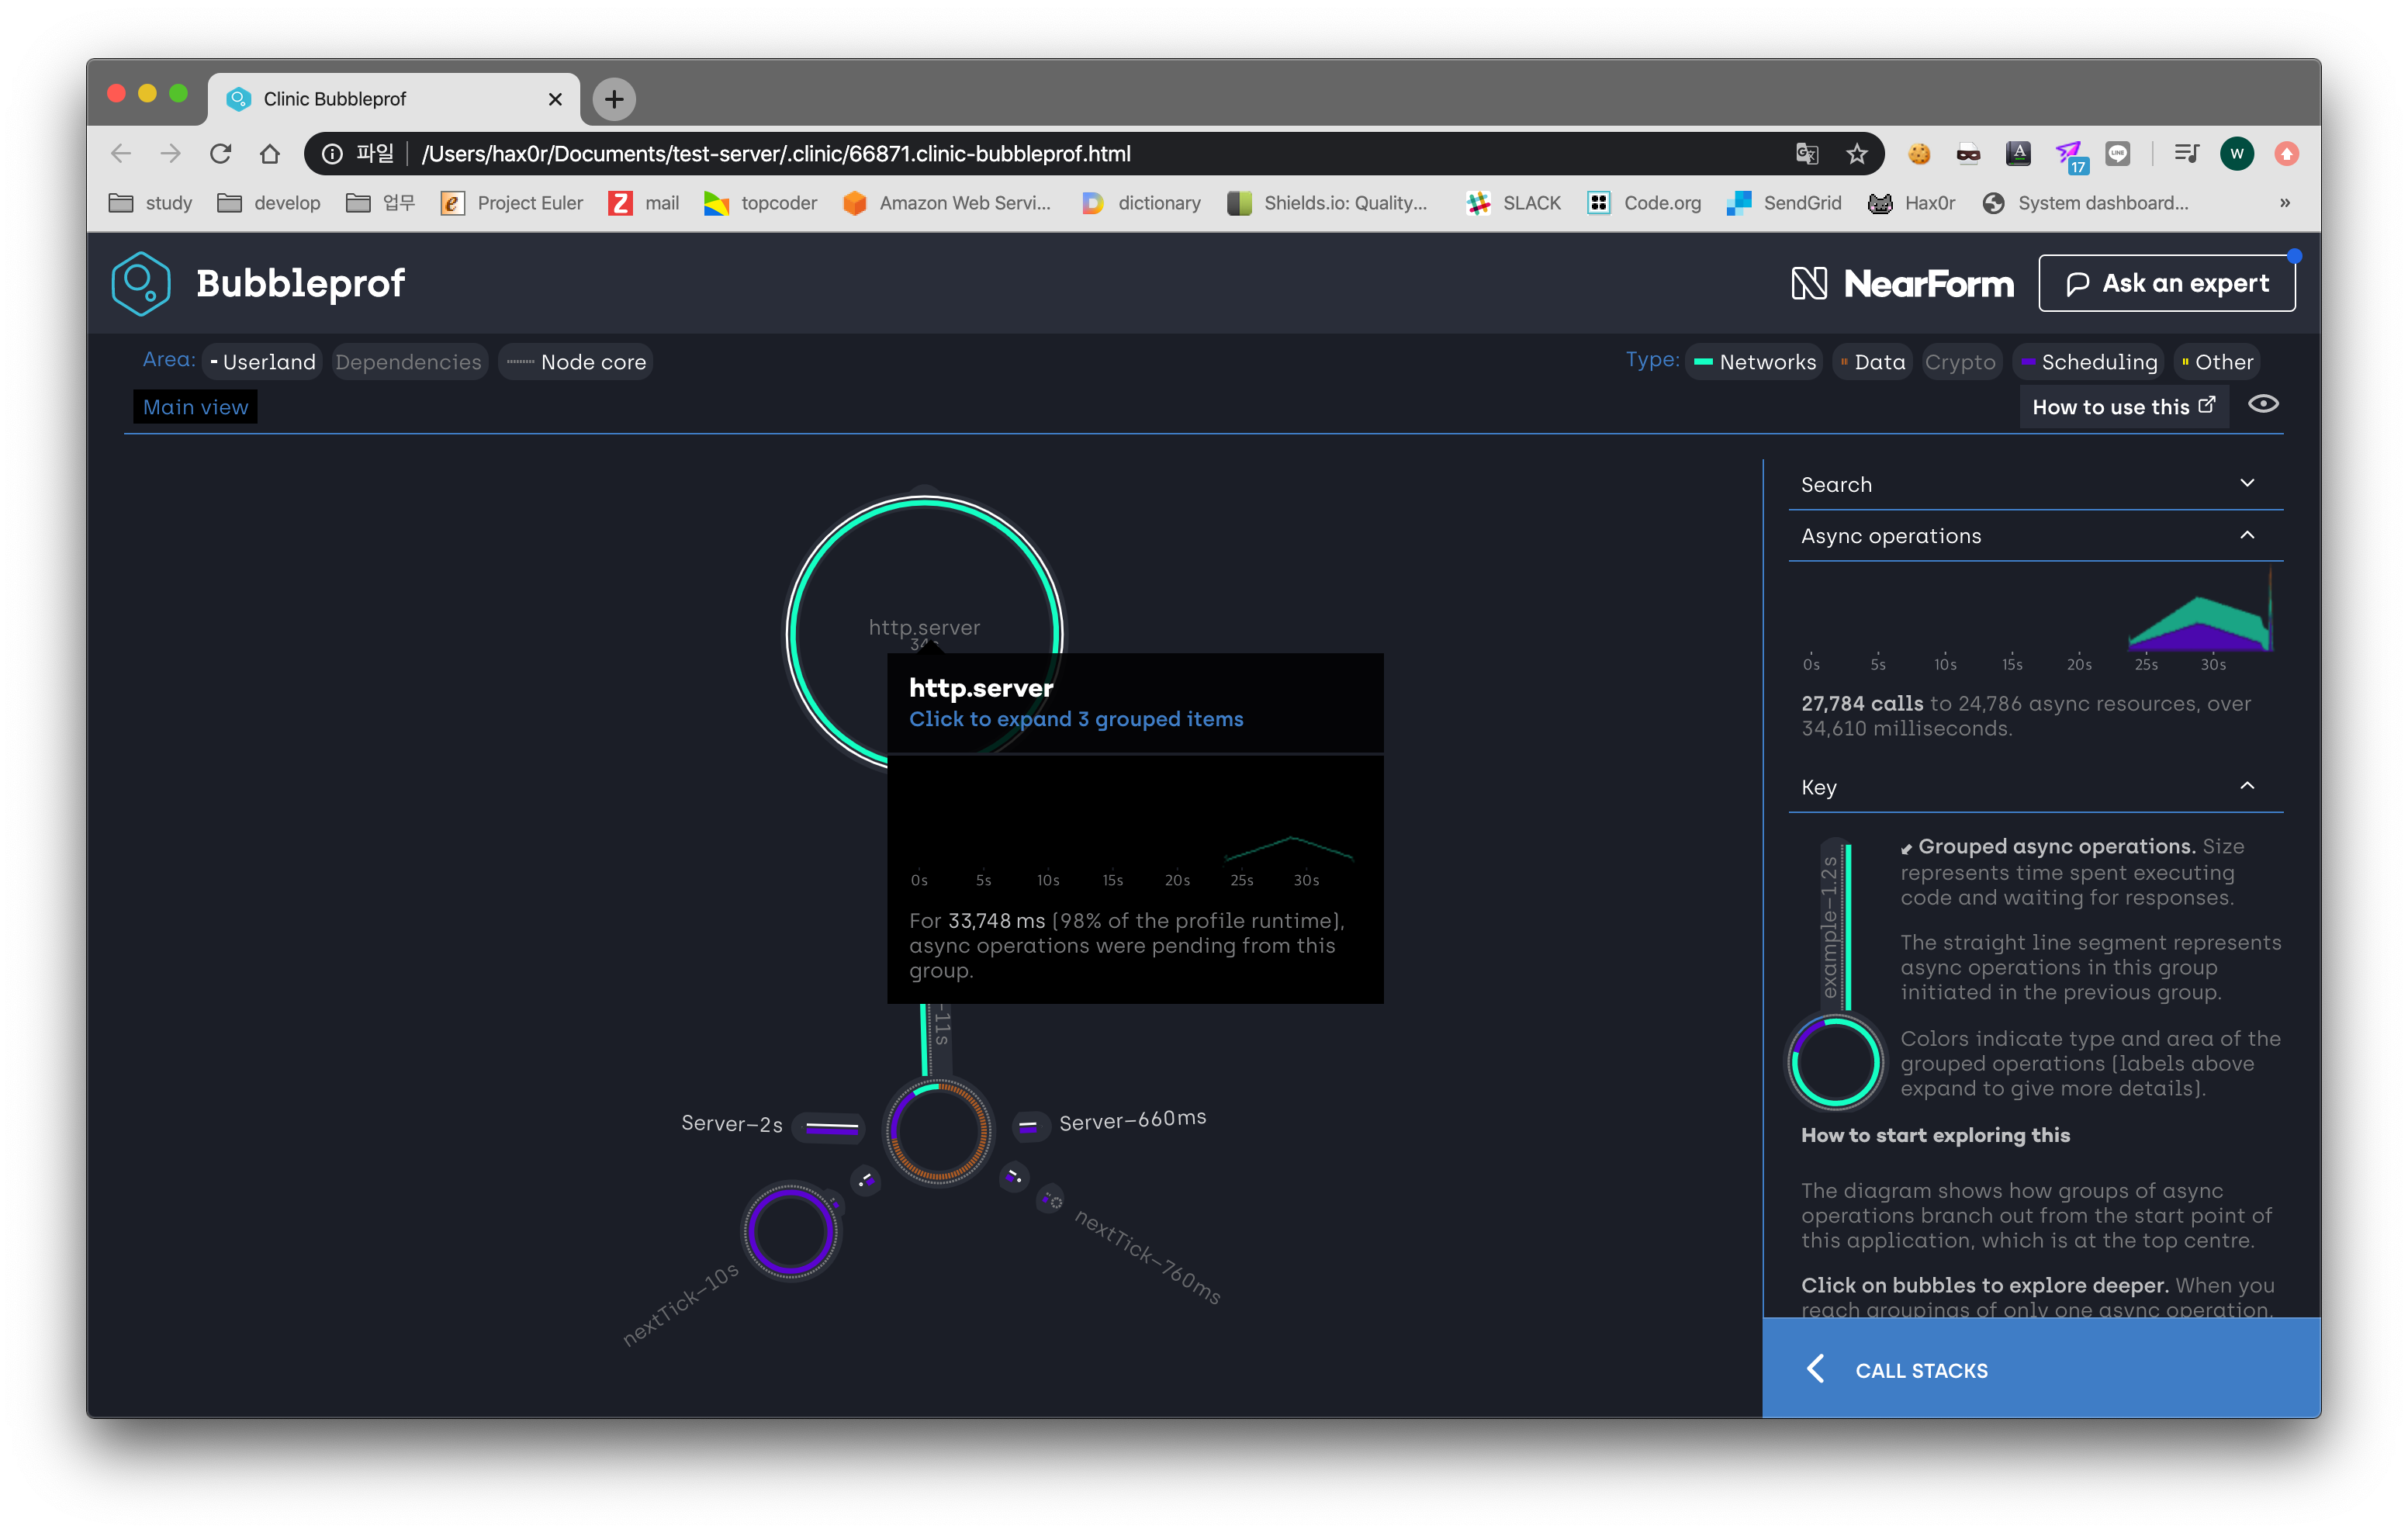
실제로 본인의 경우, 프로젝트를 릴리즈 하기 전 메모리 누수 부분을 확인하여 수정한 경험이 있다. 또 어디선가 발생하는 병목 현상에 대해서도 코드 레벨에 수정하였다. Unit/E2e/Stress 테스트를 모두 구비했다면 무엇이 두려울까, 다들 쫄지말고 배포합시다.

영준 (=hax0r)
https://www.hax0r.info
I am a passionate back-end developer always in hunger of learning new things and sharing what i have learned. who loves challenges, newest technologies and programming at all.